
Conrad Electronic sell the Voltcraft K204 datalogger, which is a 4 channel temperature logger. [Note that the above link is to the German Conrad website. The links to other sites are, unfortunately, not the same, so you will have to perform a search on each national site.]
The logger allows you to capture up to 16,000 samples from up to four different K-Type temperature probes. Depending on the probes, a temperature range of -200°C (-328°F) to 1370°C (2498°F) may be covered with a 0.1°C resolution.
The K204 sports a serial port and comes with a RS232 cable. No Macintosh computer has come with a RS232 port for the last … what … decade or so?
Fortunately for me, Conrad also sell a USB adapter for the device. Unfortunately, but predictably, only Microsoft Windows compatible software is included on the CD.
I plugged the USB adapter in and checked the device ID. It turns out that the adapter is basically a Silicon Labs CP2102 USB to UART bridge . Silicon Labs provide a number of drivers , including a Linux and a Mac OS X driver for the device. Conrad provide a brief description of the communications protocol used by the K204. That is what I call useful customer support!
After a couple of hours of work, most of which where spent figuring out the differences between the protocol description and the real protocol, I had a working application to read all data samples from the device on Mac OS X.
It is very simple to use:
1. Open a Terminal.app.
2. Type:
> k204 /dev/tty.SLAB_USBtoUART dumpfile.txt
where /dev/tty.SLAB_USBtoUART is the serial device created by the driver and dumpfile.txt is the file you want to create.
This will create a file with content similar to this sample:
Data Set:	1

Sample start:	2008-05-02 17:56:18

Sample interval in seconds:	60

Sensor type:	K-Type

Temperature unit:	Celsius

Number of sample sets:	16000

Data Set	CH1	CH2	CH3	CH4

2008-05-02 18:56:18	25.2	26.5	46.5	17.1

2008-05-02 18:57:18	25.1	26.5	46.5	17.1

2008-05-02 18:58:18	25.1	26.6	46.5	17.1

2008-05-02 18:59:18	25.2	26.6	46.5	17.0

2008-05-02 19:00:18	25.1	26.6	46.5	17.0

2008-05-02 19:01:18	25.2	26.5	46.5	17.0

2008-05-02 19:02:18	25.2	26.6	46.5	17.0

2008-05-02 19:03:18	25.2	26.4	46.5	17.0
Note that you may have multiple data sets, depending on how and what you captured. In this case, you will have multiple Data Set: headers.
The fields are TAB (‘\t’) separated.
3. You can remove the header from the file using a text editor or by using the shell command
tail -n +7 dumpfile.txt >dumpfile.tsv
4. Your favorite data display tool will now render the file. You can use OpenOffice/NeoOffice or Excel or whatever. I like using gnuplot :
# Plot data downloaded from K204 Thermologger

# These settings are optimized for use with the PostScript driver.
# define line styles

set style line 1 linetype 1 linecolor rgb "red" linewidth 1

set style line 2 linetype 2 linecolor rgb "dark-red" linewidth 1

set style line 3 linetype 3 linecolor rgb "orange" linewidth 2

set style line 4 linetype 4 linecolor rgb "blue" linewidth 1

set style data fsteps
set xlabel "Date\Time"

set timefmt "%Y-%m-%d %H:%M:%S"	#2008-03-21 13:20:00

set yrange [ 0 : 80 ]

set xdata time

#set xrange [ "2008-03-25 15:28:19":"2008-03-26 20:52:54" ]

set ylabel "Temperature\n° C"

set format x "%d.%m.%y\n%H:%M:%S"

set key inside left top vertical Right noreverse enhanced autotitles nobox

set style data fsteps
set grid nopolar

set grid xtics nomxtics ytics nomytics noztics nomztics \

nox2tics nomx2tics noy2tics nomy2tics nocbtics nomcbtics

set grid layerdefault   linetype 0 linewidth 1.000,  linetype 0 linewidth 1.000
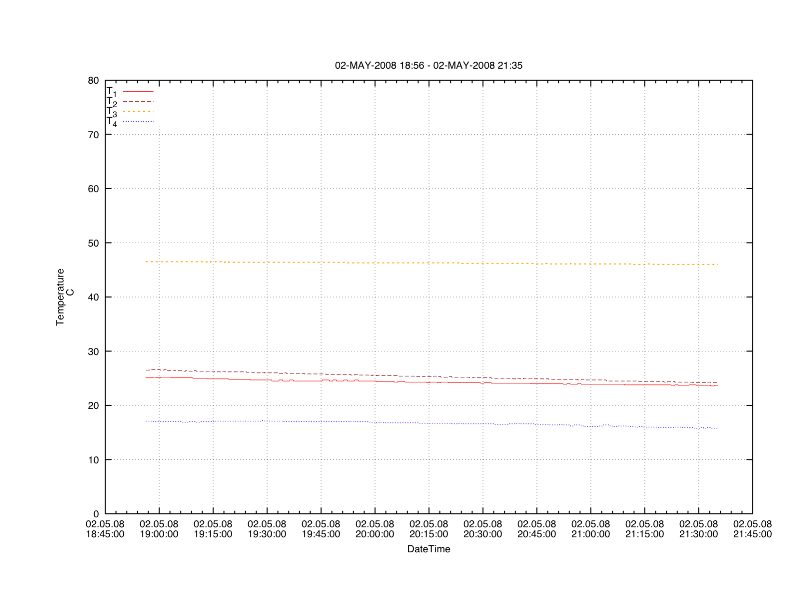
set title "02-MAY-2008 18:56 - 02-MAY-2008 21:35"

plot "dumpfile.tsv" using 1:3 title "T_{1}" linestyle 1, \

"dumpfile.tsv" using 1:4 title "T_{2}" linestyle 2, \

"dumpfile.tsv" using 1:5 title "T_{3}" linestyle 3, \

"dumpfile.tsv" using 1:6 title "T_{4}" linestyle 4
Which gives you this – admittedly somewhat boring, but rather good-looking – plot:
Congratulations, you have made it this far, so here is your reward: I am releasing the sources under a BSD-style license .
The sources compile and run under Mac OS X 10.4.9 and later. I have not tried 10.5 yet, but I see no reason why there should be a problem.
Update: It works just fine under 10.5. 🙂
Similarly, I fully expect the program to compile and run under most BSD or Unix variants (including Linux), providing they support the tcgetattr() /tcsetattr() options used.
I am very interested in hearing from you if you deployed the program on other platforms. Drop me a line or submit a comment and, most importantly, share your modifications so that everyone can profit. Have fun!
Update 21-JAN-2009: Silicon Labs have changed the links on their website, so I changed mine. Come on guys, how long have you been at this web game?
Tags: BSD, datalogger, driver, gnuplot, Mac OS X, open source, Software, source code, temperature, Unix
-
Communication with the K204 works, device type is displayed as 304. Unfortunatelly, the data sets are always empty. Is there some special magic I need to perform to get temperatures to be dumped? “Transmitting 0 bytes in 0 data sets.” the k204 says and then the program exits.
-
What version of Mac OS X are you using? In 10.4 I could just plug in the adapter and everything worked just fine. Since I upgraded to 10.5 it seems that I have to boot the machine while the adapter is plugged in to a USB port.
I believe that the error was what you describe if I did not boot with the adapter plugged in … I will check when I get home tonight.
-
My tests show that in Mac OS X 10.5.6 with the v1.06 driver you have to boot with the adapter connected or you will get the “Transmitting 0 bytes in 0 data sets.” behavior.
With the (currently) most recent v2.1 driver you can hot-plug the adapter and data will be transmitted just fine.
Comments are now closed.

3 comments